Best Free SSD Benchmark Tool to Test Storage Performance
If your computer feels sluggish, your storage drive could be the problem. A slow hard drive or SSD can bottleneck your system, no matter how powerful your CPU and RAM are. That’s where a disk benchmark tool comes in.
It measures storage performance, including read/write speeds, latency, and access time, helping you identify issues and optimize your system.
Read more:
Best disk benchmark software
- Aida64 – best disk benchmark software overall
- Speccy – best system information tool
- AOMEI – best disk management software
- CrystalDiskMark – best for testing sequential read/writes
- PCMark10 – best for overall system performance assessment
- Novabench – best for multi-platform performance testing
- ATTO Disk Benchmark – best for small block benchmarks
- AS SSD Benchmark – best tool for benchmarking SSDs
- Anvil’s Storage Utilities – best for mixed workload benchmarks
- HD Tach – best for sequential read benchmarks
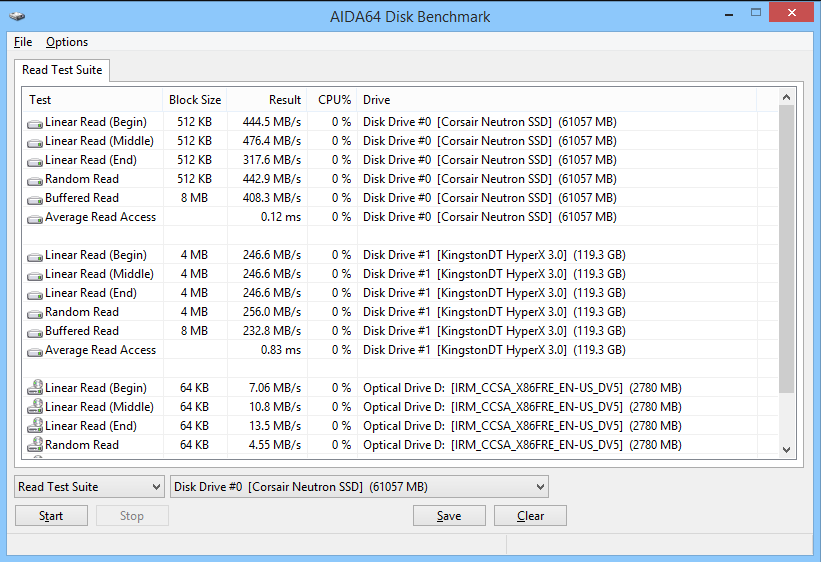
1. Aida64 – best disk benchmark software overall
- Operating System: Windows
- Pricing: Paid
- Developer: Aida64
Aida64 is an all-in-one benchmarking and diagnostic tool that provides a detailed system analysis.
It helps you troubleshoot storage performance issues, detect bottlenecks, and optimize your SSD or HDD.
Key Features:
- Comprehensive system performance testing
- Multi-threaded disk benchmark engine
- Detailed reports with extensive logging
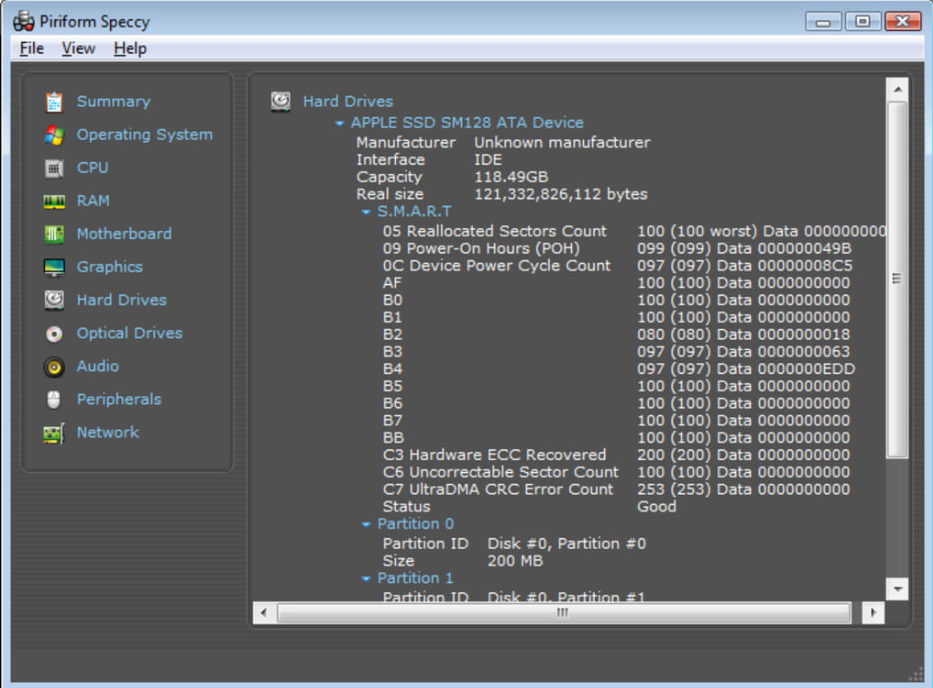
2. Speccy – best system information tool
- Operating System: Windows
- Pricing: Freemium
- Developer: Piriform Software Ltd
Speccy gives you a real-time system overview, showing details on CPU, RAM, storage devices, and more.
It also tracks temperature, voltage, and fan speed, making it a great diagnostic tool for system stability.
Key Features:
- Displays real-time hardware information
- Identifies and analyzes installed storage devices
- Saves benchmark snapshots for later review
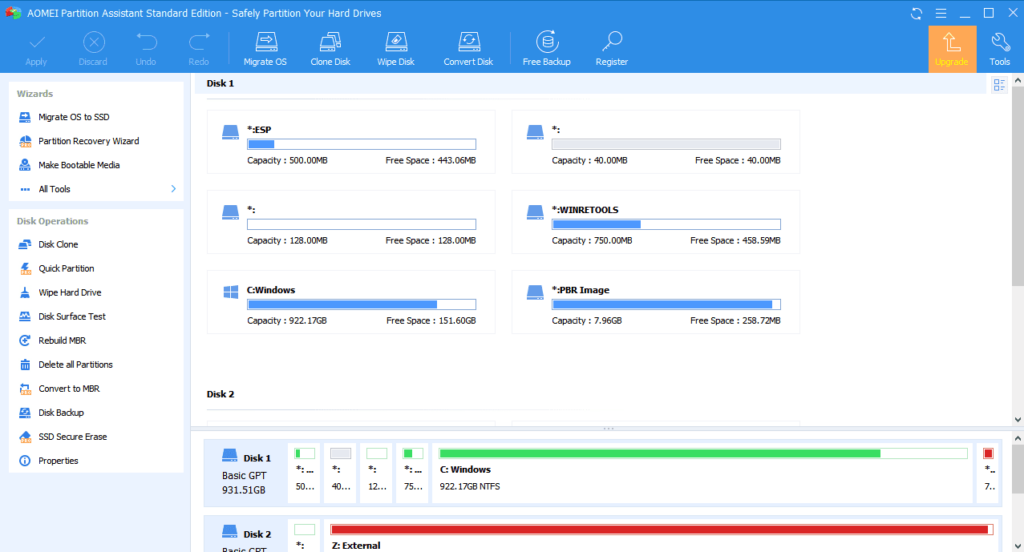
3. AOMEI Partition Assistant – best disk management software
- Operating System: Windows, Windows Server, Mac.
- Pricing: Paid
- Developer: AOMEI
AOMEI is more than just a benchmarking tool—it’s a full disk management suite.
It lets you optimize SSDs and HDDs, securely erase storage, and even create a bootable USB drive for recovery.
Key Features:
- Tests both HDD and SSD performance
- Customizable benchmark settings
- Graphical reports for easy interpretation
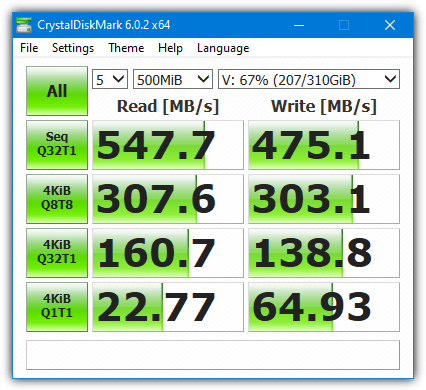
4. CrystalDiskMark – best for testing sequential read/writes
- Operating System: Windows.
- Pricing: Free
- Developer: CrystalDiskMark
CrystalDiskMark is one of the most popular disk benchmarking tools, known for its sequential and random read/write performance testing.
It works with SSD drives, HDDs, USB storage, and RAMDisks.
Key Features:
- Measures sequential and 4K speeds
- Supports different file sizes and queue depths
- Portable and installer versions are available
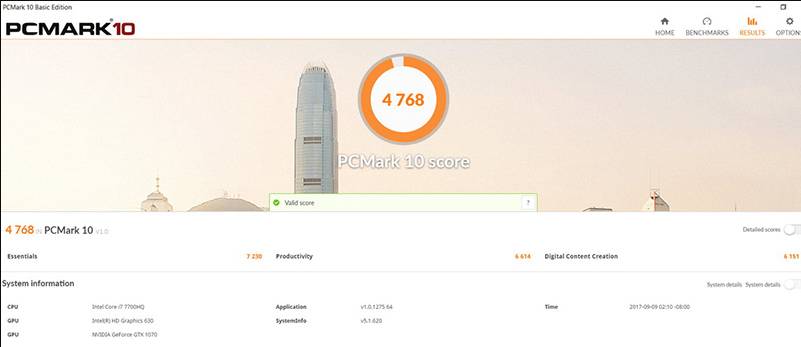
5. PCMark10 – best for overall system performance assessment
- Operating System: Windows.
- Pricing: Paid
- Developer: UL Software
PCMark10 doesn’t just test storage performance—it evaluates CPU, GPU, and RAM as well.
It runs real-world benchmarking tests, including file copying, application loading times, and multitasking.
Key Features:
- Benchmarks multiple hardware components
- Includes real-world performance tests
- Professional edition for advanced users
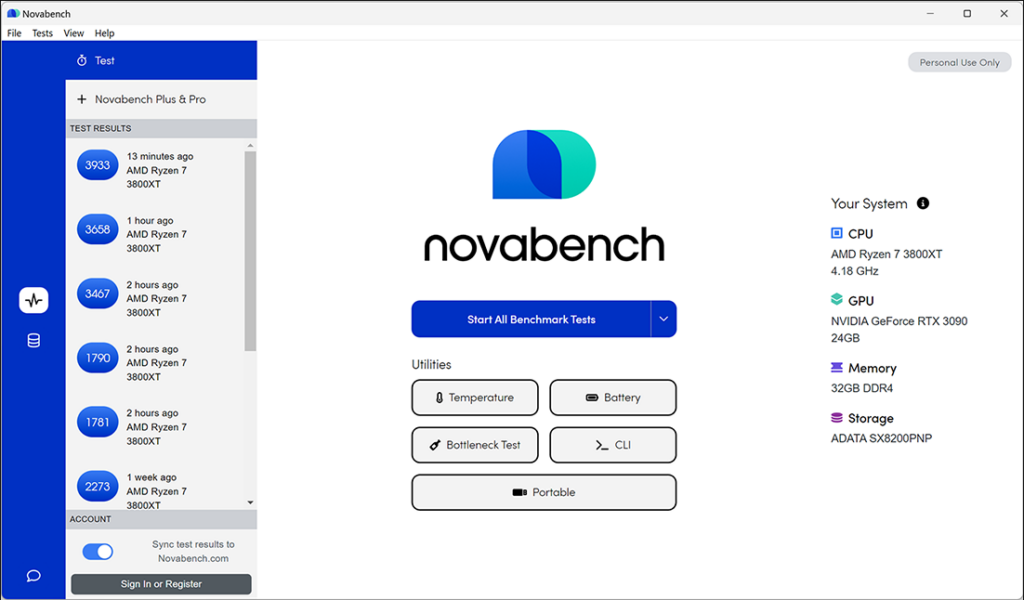
6. Novabench – best for multi-platform performance testing
- Operating System: Windows, Mac, Linux.
- Pricing: Freemium
- Developer: Novabench Inc.
Novabench is a cross-platform benchmarking tool that evaluates SSD and HDD speeds, CPU performance, and RAM performance.
Its real-world testing approach makes it great for practical system analysis.
Key Features:
- Tests overall system performance
- Compares your results with similar systems
- Lightweight and easy to use
You may also want to read:
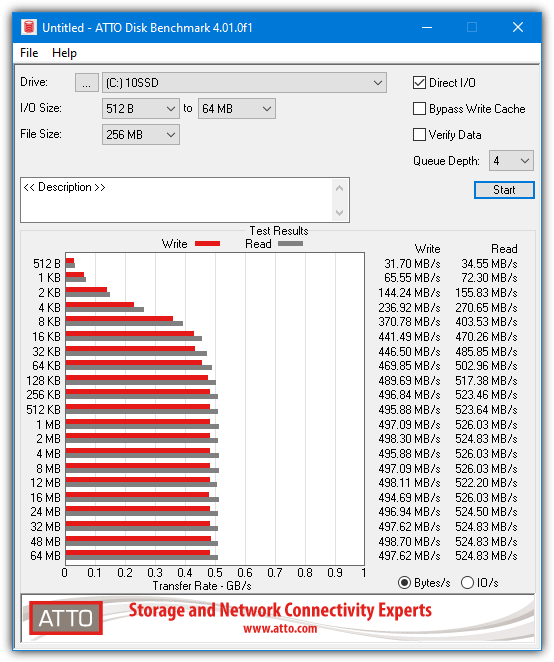
7. ATTO Disk Benchmark – best for small block benchmarks
- Operating System: Windows.
- Pricing: Free
- Developer: ATTO Disk Benchmark
ATTO Disk Benchmark is widely used by hardware review sites and manufacturers for testing SSD performance. It measures sequential read/write speeds with different block sizes and queue depths.
? Key Features:
- Adjustable transfer sizes and test lengths
- Supports multiple storage interfaces (SATA, NVMe, USB, etc.)
- Saves and loads benchmark results for comparison
Download ATTO Disk Benchmark (the official site requires filling out a form)
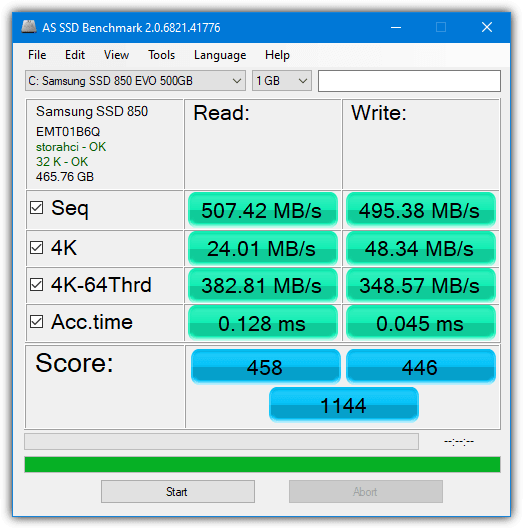
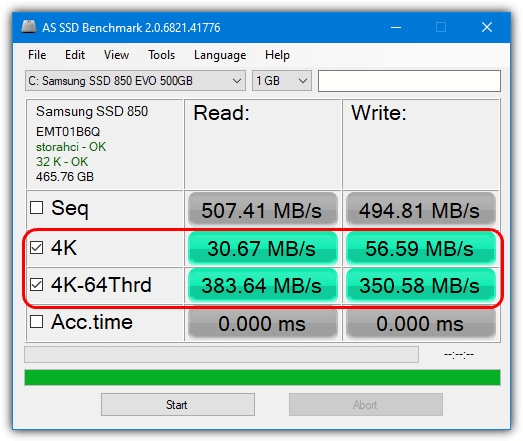
8. AS SSD Benchmark – best tool for seq-testing SSDs without using OS cache
- Operating System: Windows.
- Pricing: Free
- Developer: Alexej Schepeljansk
AS SSD Benchmark is designed specifically for SSD testing, using incompressible data to assess sequential and random read/write speeds, latency, and IOPS.
Key Features:
- Measures SSD performance without OS cache interference
- Includes copy benchmark and compression tests
- Portable and lightweight
Download AS SSD Benchmark (via TechSpot, the download link on the right)
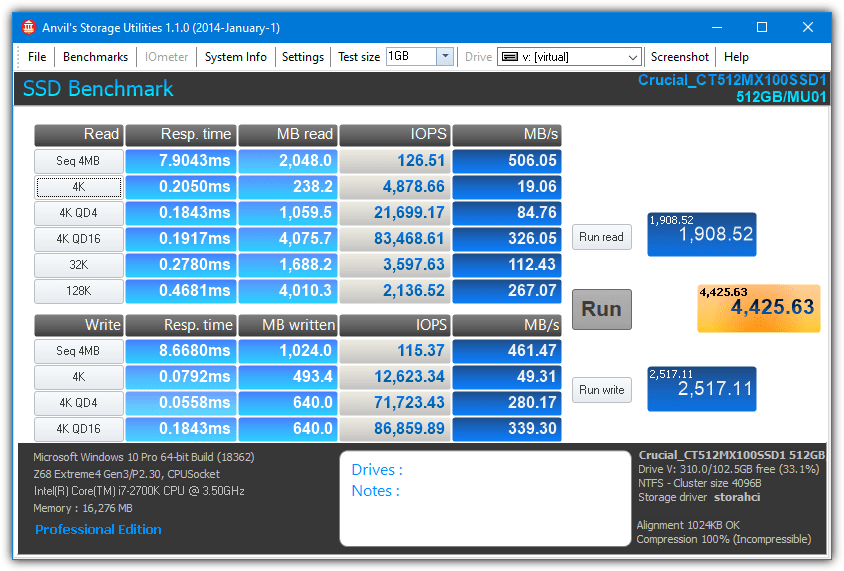
9. Anvil’s Storage Utilities – best for mixed workload benchmarks
- Operating System: Windows.
- Pricing: Free
- Developer: Anvil
Anvil’s Storage Utilities runs thorough SSD and HDD performance tests, measuring response time, throughput, and IOPS.
It also includes compression benchmarking and endurance testing.
Key Features:
- Tests sequential and random read/write speeds
- Advanced compression and endurance tests
- Detailed performance reports
Download Anvil’s Storage Utilities
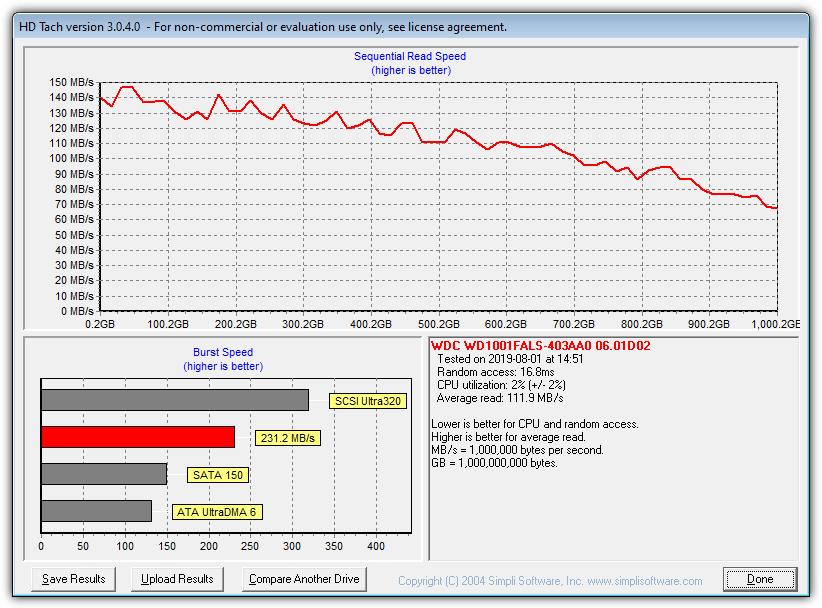
10. HD Tach – best for sequential read benchmarks
- Operating System: Windows.
- Pricing: Free
- Developer: TCD Labs
HD Tach is an older but still useful disk performance test tool for measuring sequential read speeds, burst speed, and CPU utilization. It requires XP compatibility mode on newer Windows versions.
Key Features:
- Measures burst speed and average transfer rates
- Provides a graphical representation of drive performance
- Simple and quick testing process
Overview of best disk performance test tools
| Software | Top Features | Sequential tests | Random Tests | Mixed workload tests | Customize test parameters |
| Aida64 | Customizable benchmark settings and test parameters. Extensive reporting and logging capabilities. Support for a wide range of hardware and software platforms. | Yes | Yes | Yes | Yes |
| Speccy | Overview of system performance and health. Easy-to-use interface and intuitive navigation. Option to save and export system snapshots for analysis or sharing. | No | No | No | No |
| AOMEI | Multiple test modes, including sequential and random access tests. Support for customizing test parameters and settings. Graphical representation of benchmark results for easy interpretation. | No | No | No | Yes |
| CrystalDiskMark | Sequential and random read/write performance testing. Multiple test profiles, including different file sizes and queue depths. Measurement of important performance metrics such as sequential and 4K speeds. | Yes | Yes | No | No |
| PCMark10 | Assessment of storage performance, including SSD and HDD speeds. Benchmarking of CPU, GPU, and RAM performance. Detailed performance scores and results. | Yes | Yes | Yes | Yes |
| Novabench | Real-world tests and simulations for practical performance evaluation. Detailed performance scores and results. Cross-platform | Yes | Yes | No | No |
| ATTO Disk Benchmark | Ability to assess performance for different file sizes and transfer types. Graphical representation of performance results. Compatibility with a wide range of storage devices and interfaces (SATA, NVMe, USB, etc.). | Yes | No | No | No |
| AS SSD Benchmark | Assessment of access time and latency. Copy benchmark for testing file transfer speeds. Detailed performance scores and results. | Yes | Yes | Yes | No |
| Anvil’s Storage Utilities | Sequential and random read/write testing. IOPS measurement and latency assessment. Advanced features like compression benchmark and endurance testing. | Yes | Yes | Yes | Yes |
| HD Tach | Error scan for detecting and analyzing drive errors. Drive information and statistics. Option to benchmark specific file types or locations. | Yes | No | No | No |
Benchmark Notes
For less experienced users, a lot of the numbers thrown up by any benchmarking tool can look a bit confusing because you might not know what you’re supposed to take notice of. A few simple things to look for are:
Sequential (also seq or linear) – This is the speed at which a drive can read or write continuous data in the form of large files. It’s better for data storage drives or game partitions to have a higher sequential speed where most files will be at least a Megabyte in size. Sequential tests will show a drive’s maximum possible read and write speeds.
4K – The 4K results produced by benchmark tools show how fast a drive is at accessing small files and are more important for a Windows boot drive. Most notably, random 4K read and write speeds show how quickly the files are accessed when scattered across a partition. Higher 4K results will also produce a better and smoother Windows during multitasking. When looking at buying an SSD drive to install Windows and applications, compare the 4K scores first and not the headline-grabbing sequential speeds.
SSD Benchmark Tools – Comparative Overview
| Tool | Sequential Performance (MB/s) | Random IOPS | Latency/Access Time | Queue Depth Control | Composite Score | Comments / Notes |
|---|---|---|---|---|---|---|
| AIDA64 | Reports sequential speeds (e.g., ~520 MB/s for many SATA SSDs) | Basic random tests; not deeply granular | Provides basic latency figures | Limited control; uses built?in disk test | N/A | Broad system diagnostic tool; disk test is part of overall diagnostics—not optimized for deep SSD random performance analysis. |
| Speccy | N/A – does not perform active benchmarks | N/A | N/A | N/A | N/A | Provides a detailed hardware snapshot (model, firmware, temperature, S.M.A.R.T. data) but no performance numbers. |
| AOMEI (Partition Assistant) | Provides basic sequential speeds (e.g., ~500 MB/s read, ~480 MB/s write) | Limited random IOPS data | Not specifically reported | Minimal; preset test parameters | N/A | Combines partitioning/disk management with a basic disk speed test; lacks advanced customization for IOPS and latency testing. |
| CrystalDiskMark | Typical results: SATA SSD ~500 MB/s; NVMe can exceed 3000 MB/s | 4K random tests: SATA SSD ~70–100K; NVMe >100K K IOPS | Latency is indirectly inferred (often <1 ms for NVMe) | Allows setting different queue depths (e.g., 32) | Uses “Score” in some reports, but not a unified composite score | Widely adopted for its clear, replicable tests; focuses on synthetic workloads for both sequential and random performance. |
| PCMark10 | Measures overall “storage sub?score” rather than raw MB/s numbers | Incorporates random workload performance into composite score | Latency effects are part of the overall simulation | Not directly adjustable; part of full?system workload simulation | Provides an overall storage impact score (often 10–15% higher for NVMe systems compared to SATA) | Full?system benchmark simulating real-world tasks, which integrates SSD performance with other system components. |
| Novabench | Reports sequential speeds (e.g., ~480–520 MB/s) | Provides a basic disk score that infers random performance | Latency not reported separately | No detailed queue depth adjustment | Disk score (typically in the range of 350–400 points) | Offers a quick overall system performance snapshot; its disk test is less granular than specialized SSD benchmarks. |
| ATTO Disk Benchmark | Provides detailed sequential speeds across various block sizes (e.g., peaks around 550 MB/s) | Does not focus on random IOPS | Not designed to measure latency explicitly | Yes – lets you vary block sizes and queue depths | N/A | Best for analyzing how sequential performance scales with different transfer sizes; does not simulate typical small-block random I/O workloads. |
| AS SSD Benchmark | Typical sequential speeds (e.g., ~500 MB/s for SATA; higher for NVMe) | Provides detailed random IOPS (e.g., SATA: ~90–110K IOPS) | Measures access time directly (e.g., 0.1–0.2 ms for NVMe) | Offers multi?threaded tests (e.g., 64 threads for 4K tests) | Provides a composite “SSD Score” combining all results (often >8000 for high?end NVMe) | Designed specifically for SSDs using incompressible data; focuses on both raw performance and access times. |
| Anvil’s Storage Utilities | Provides advanced sequential performance data (similar to CrystalDiskMark, but more customizable) | Detailed random IOPS metrics (e.g., NVMe may show >150K IOPS) | Reports average and peak latency (often in the sub?ms range) | Extensive – allows fine?tuning of queue depths, block sizes, and threading | May offer an overall performance index based on combined metrics | Highly technical and configurable; best for professionals who need detailed insights into SSD behavior under various conditions. |
| HD Tach | Reports sequential speeds (e.g., ~450–550 MB/s) | Does not report random IOPS | Does not measure latency in detail | No queue depth adjustments | N/A | An older, legacy tool focused on sequential read speeds and S.M.A.R.T. data; it doesn’t capture the full performance profile of modern SSDs, especially random I/O. |
Metric Definitions Recap:
- Sequential Performance (MB/s):
- Represents the maximum data transfer rate for large, contiguous blocks (important for large file transfers, video streaming, etc.).
- Random IOPS:
- Reflects the drive’s ability to handle many small, random read/write operations per second (crucial for OS responsiveness, loading applications, and general multitasking).
- Latency/Access Time:
- The delay between issuing a command and the drive beginning the data transfer, measured in milliseconds (ms) or microseconds (µs). Lower latency means quicker responsiveness.
- Queue Depth:
- Indicates the number of I/O requests that can be processed concurrently. Testing at various queue depths simulates different load conditions.
- Composite Score:
- A combined metric that aggregates several individual test results (sequential, random, latency) into a single score to simplify comparison.
Comparison Takeaway
- For a quick speed test: CrystalDiskMark is fast, simple, and widely trusted for measuring read/write speeds.
- For real-world performance: PCMark10 simulates everyday tasks like booting, gaming, and file transfers to show how an SSD performs in practical use.
- For deep performance analysis: AS SSD Benchmark and Anvil’s Storage Utilities provide detailed insights into IOPS, latency, and access times—ideal for advanced users.
- For comparing multiple SSDs: ATTO Disk Benchmark tests performance across different file sizes, helping to identify strengths and weaknesses.
- For SSD health monitoring: AIDA64 and Speccy focus on system diagnostics, providing S.M.A.R.T. data, temperature, and lifespan insights, though they aren’t dedicated benchmarking tools.
Should I benchmark my SSD?
Benchmarking has been the popular way of testing hardware performance for many years now. While it is mainly prevalent for CPUs, you can benchmark the performance of other hardware on your computer, like RAM and SSDs.
Consider benchmarking your SSD in the following situations:
- Performance evaluation – determine if your SSD is operating optimally or if there are any performance issues.
- Troubleshooting – identify potential bottlenecks or hardware/software issues.
- Comparison and selection – make an informed purchase decision based on the performance metrics that matter to you.
- Overclocking or optimization – test different settings and configurations to find the optimal balance between performance and stability.
- Curiosity – get insights into the real-world performance of your SSD.
While benchmarking your SSD can be super useful in certain cases, it has some caveats. Benchmarking involves stress testing your SSD, which wears the hardware and slows it down over time. It won’t be fatal if you run it once in a while. If you’re concerned about wear, you can limit the number of benchmarking runs or choose less stressful benchmarking tools.
Final Thoughts
Benchmarking your storage devices using disk performance test tools can be an effective way of analyzing their real-world performance.
Ensure you have reviewed the entire list of SSD and HDD performance test tools before selecting one that suits your needs.
If you’re experiencing sluggish performance on your computer, it could be due to slow storage. A tool like AMD Radeon RamDisk can help improve speed, but first, it’s a good idea to benchmark your drive. You can easily measure storage performance, including read/write speeds, using disk performance test tools to pinpoint any bottlenecks in your system.

Improve this guide

User forum
23 messages