How to Check Website Memory Usage

All web browsers seem to have gotten much more power hungry over the years. Mozilla Firefox for one has encountered several issues throughout its life relating to memory leaks and being a bit of a monster in the memory usage department at times. Others like Google Chrome, while not having problems quite as serious, are certainly not memory friendly either. Internet Explorer is lighter that those two, but can still become heavy with several websites open.
Modern web browsers use tabbed browsing and all web pages you open are displayed in the same window. Some users open dozens or even hundreds of tabs at once which can make the memory usage skyrocket. If you have several tabs open and you suspect one web page is misbehaving and taking more memory than it should, or you’re just curious to find out how light or heavy a page is, how do you find that out? Windows Task Manager really isn’t much good for this as it will just list the main processes for the browser.
Luckily, most modern browsers can tell you just how much memory an individual web page takes up in a tab, so you can identify and possibly close any offending pages. Here we show you how to access this information for the most popular web browsers.
Mozilla Firefox
A slight surprise about Firefox is despite the thousands of extensions you can add to your Firefox browser, we couldn’t actually find one that displayed the memory usage for a tab. There are plenty of monitors for showing how much memory Firefox is consuming as a whole, but not individual tabs. Thankfully there is a built in function to enable a view of how much memory separate parts of Firefox are using. This is available in Firefox based browsers as well although Waterfox has has some issues displaying the results properly.
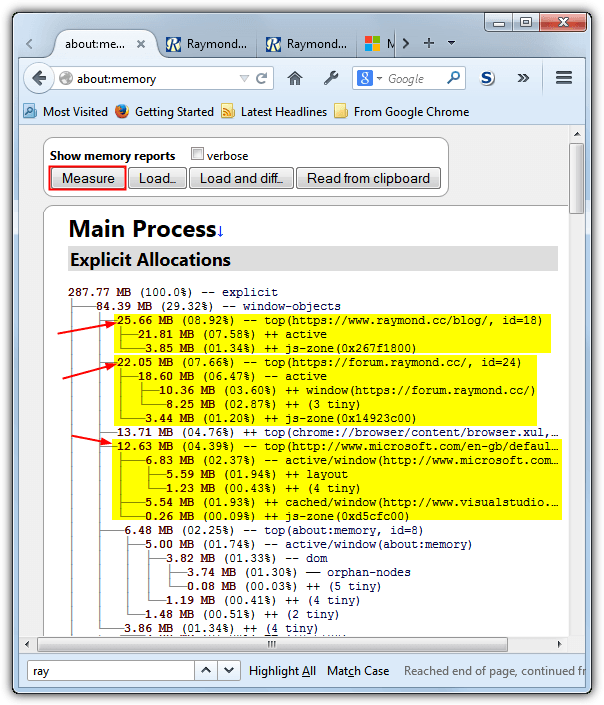
Type the following into the address bar of Firefox and press Enter:
about:memory
This will display the Firefox memory statistics page, Click Measure to populate the window with facts and figures relating to memory usage. To be honest the page is a bit messy and it’s not that easy to find the tab stats you want from the wealth of numbers. They will be listed under “Explicit Allocations” and should be somewhere near the top. The main usage stat for the tab should be on the line with “– top (website url)”, numbers in the same tree are the usage stats for individual components on the page.
Google Chrome
Chrome is a bit more informative and easy to use than Firefox when finding out how much memory an individual browser tab uses. Chrome and it’s variants (Opera, Chromium, SRWare Iron, Comodo Dragon etc) all have access to a built in task manager inside the browser that shows how much memory and CPU each tab and extension is consuming.
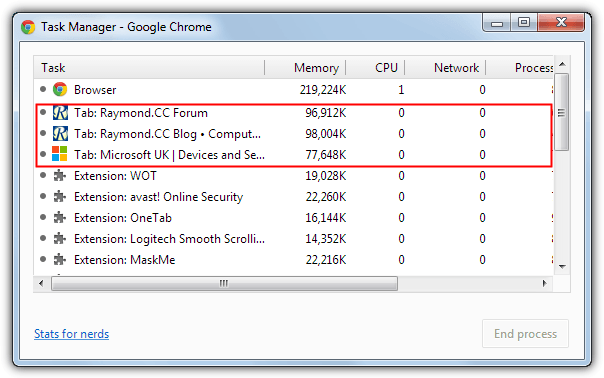
There is at least three ways to get to the Chrome Task Manager, the easiest two are clicking on the Settings icon > Tools > Task Manager or simply pressing Shift+Escape. Below the main Chrome process in the list will be the open tabs with the tab title, used memory, CPU usage, network usage, main process ID and frames-per-second. If you notice a tab taking up huge amounts of memory or hogging the CPU, click on it a press the “End process” button.
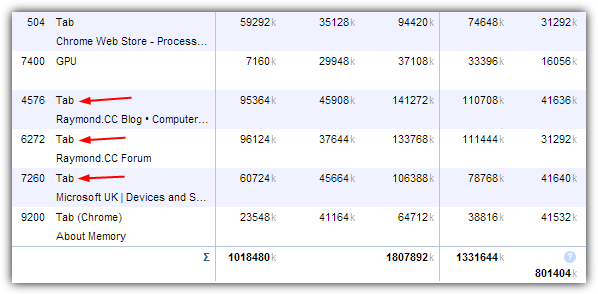
Google Chrome also has a “stats for nerds” page which is similar to Firefox’s page. Click on the stats for nerds link in the Task Manager or type about:memory in the address bar. This gives more specific tab usage details including virtual, shared, mapped and private memory.
At the Chrome Web Store there is an add on extension that also shows the memory or CPU usage of tabs via a popup in the extensions bar at the top right, it’s called Process Monitor.
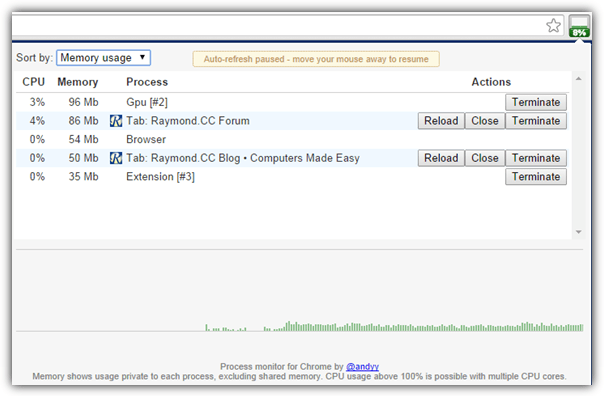
In addition to viewing the stats in question, you also have the opportunity to reload the tab or close it. The drawback with Process Monitor is it only seems to work on development versions of Chrome/Chromium and not the general release stable versions.
Microsoft Internet Explorer
What might be a surprise to many is that Internet Explorer possibly has the most useful memory usage display for individual tabs because it is displayed as a popup in the window of each tab. This means you can continue to view the page itself and glance at the popup without having to open and view a separate tab. Do note this is only available in Internet Explorer 11 and not in older versions.
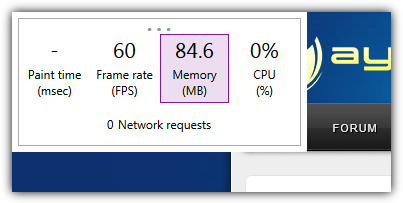
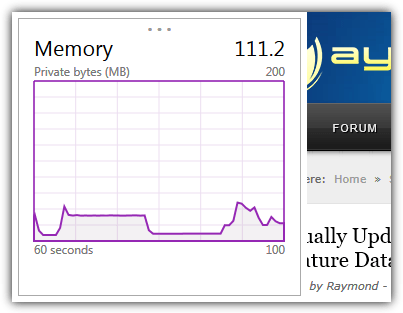
Known as the Performance Dashboard, you can open the popup in two ways. Press Alt+T to bring up the Tools menu and select “Performance Dashboard”, or simply press Ctrl+Shift+U. It can be moved around the window by clicking and dragging on the three dots at the top. The dashboard shows live measurements for paint time (render changes), frame rate, CPU usage and memory usage. Click on one to popup a small graph with the last minute of history for that statistic. Click again to return to the dashboard.
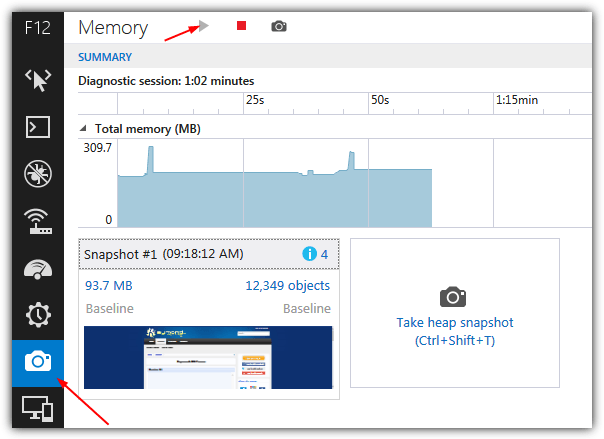
Internet Explorer also has a more comprehensive component in the F12 Developer Tools for monitoring a tab’s memory over a longer period of time, with the added ability of taking snapshots of the page at a certain point. Press F12 to bring up the Developer Tools and select Memory (Ctrl+7). Then click the Start button to begin a profiling session, if the graph rises over time, the page likely has a memory issue.
Microsoft has a number of pages to help with diagnosing issues with memory in Internet Explorer, “Diagnosing memory problems in you web pages” and “Debugging and Tuning Web Sites and Apps with F12 Developer Tools in IE11” are worth a read to find out more about how to use Internet Explorer and the Developer Tools.
Download Microsoft Internet Explorer 11 (Offline installer)


User forum
1 messages