5 Tools To Monitor WiFi Connection Signal Strength [2023]
Wireless internet is everywhere these days and you could have several WiFi capable devices connected to your own wireless network. Because of that it’s important the WiFi router is placed in the best available location to give the longest range and strongest signal to as many devices as possible. If the router is placed in a poor location the signal could be weak, intermittent or cause constant dropouts.
There are many factors that can affect the quality and strength of a WiFi network connection. These include walls, floors, ceilings, electrical appliances, anything emitting radiation or electromagnetism, and of course distance to the router. Windows and most bundled WiFi software allows you to see how good the current wireless signal is. To get a better idea how the signal is behaving and whether it gets affected by other factors it’s a good idea to monitor the signal strength over a period of time.
Watching how your WiFi signal behaves over several minutes or even hours could help identify if the current location for it is ideal or causing problems. Here we list 5 free tools that show a graph for your wireless signal so you can watch it over a period of time to see how it behaves.
1. NetSpot
NetSpot is a free wireless network signal analysis and troubleshooting tool available for both Mac and Windows computers. In addition to a standard WiFi discovery and monitoring section it also has a site survey feature that allows for the relative network signal strengths to be plotted onto a map of your building or local area.
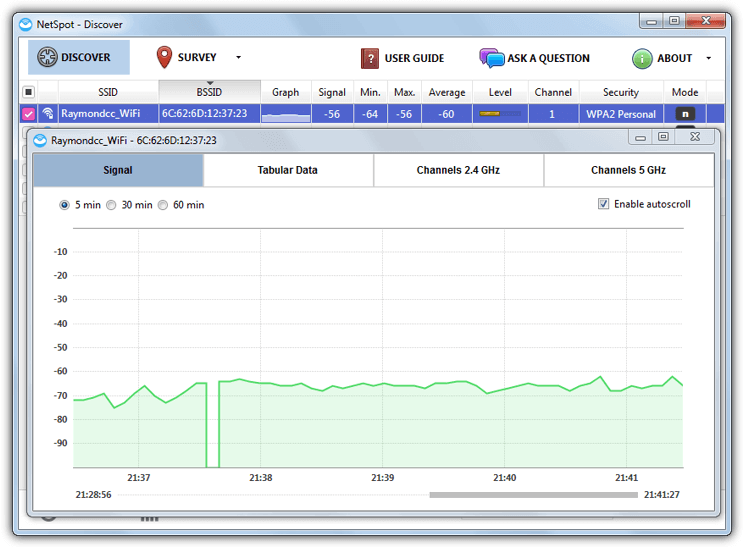
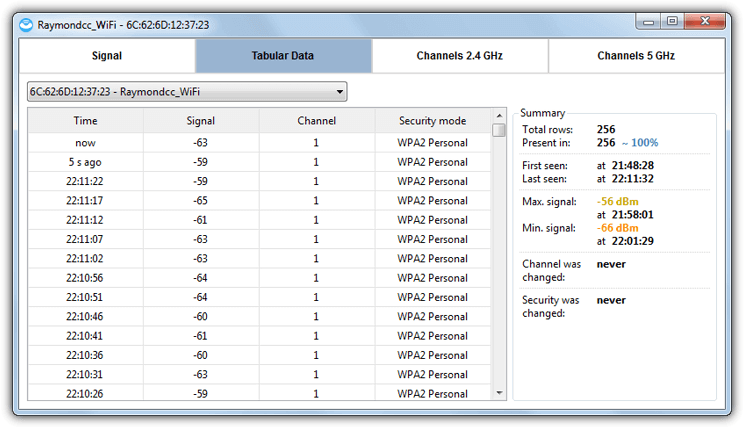
The program starts in Discover mode which shows available wireless networks along with some general statistics. Double click on the target network to open the details window. This has a Signal tab which shows a graph of the signal strength over a period of time, the last 5, 30, or 60 minutes can be shown in the window at once. Also available is a Tabular Data window that shows the same data as the graph but in text form.
The frequency of the signal strength scanning can be either left at the default of 5 seconds or changed to 10, 30 or 60 seconds. Do be aware that NetSpot crashed for us on first run but appeared to work fine after a system reboot.
2. inSSIDer
The sad thing about inSSIDer is it stopped being free and became a shareware application from version 3 onwards. Luckily version 2 remains free and open source although it’s not had any updates since 2012 and compiled versions with the free source code are a bit hard to find.
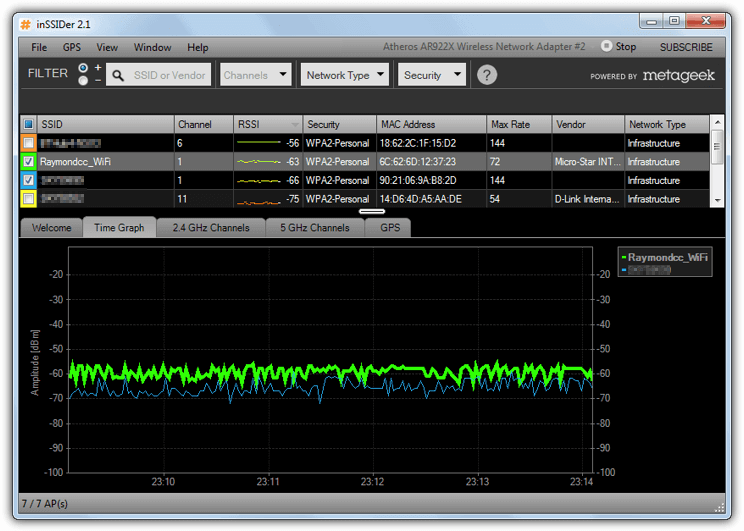
After installing and running the program click the Time Graph tab to see the signal strength graphs for all found wireless networks. Uncheck those you don’t want to appear in the graph display to be left with the signals to be monitored. The display shows signal strength over a period of 5 minutes and any selected SSID will be shown in bold. Although you cannot view the signal for more than the 5 minutes you can right click on the graph and copy an image of it to the clipboard for a snapshot record. This can in turn be pasted into a paint program.
3. Homedale
Homedale has a big advantage over the other tools here because it’s the only one that is completely portable, which many people prefer. The program is well laid out and easy to use. Besides the signal graphs you can also get your location at the click of a button from a mapping service such as Google.
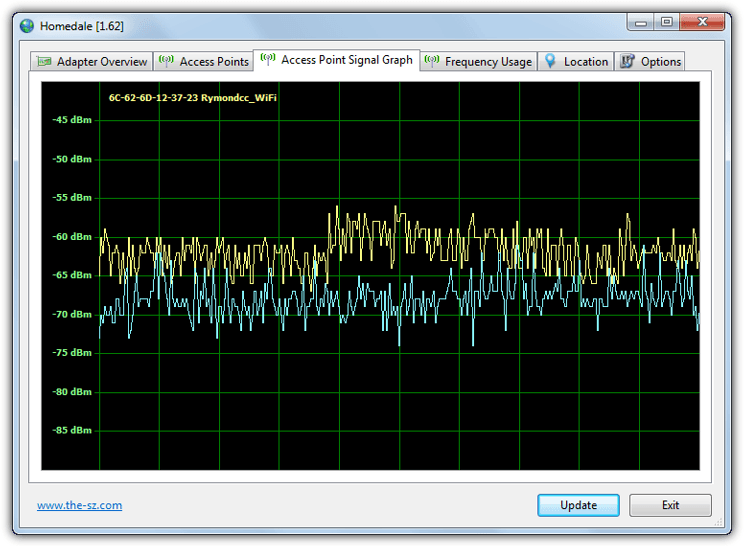
Monitoring a wireless network is a simple case of going into the Access Points tab and double clicking on the access point. Its icon will turn red to signify it has been selected and you will be shown the current signal strength graph. The graph itself refreshes every 2 seconds by default and shows about 20 minutes worth of signal history. The refresh rate can be changed from the Options tab to 1, 5, 10, 30 or 60 seconds. Right click to save the current graph as an image or start logging the history data to a text file.
Homedale also supports a few command line switches so you can launch it to start monitoring and logging a specified network automatically. Use /? in a Command Prompt to get a list of arguments that can be used. For example the following will create a log.txt and add a signal strength entry every 3 seconds for the SSID Raymondcc_WiFi.
Homedale -s Raymondcc_WiFi -l log.txt -r 3000
4. Acrylic Wi-Fi Home
The Home version of Acrylic Wi-Fi is free for personal use and has enough to show a signal strength graph for monitoring or troubleshooting. One useful feature missing and only available in the paid Pro version is the ability to alter the timeline of the signal strength graph from the default of 5 minutes to 1, 3 or 10 minutes.
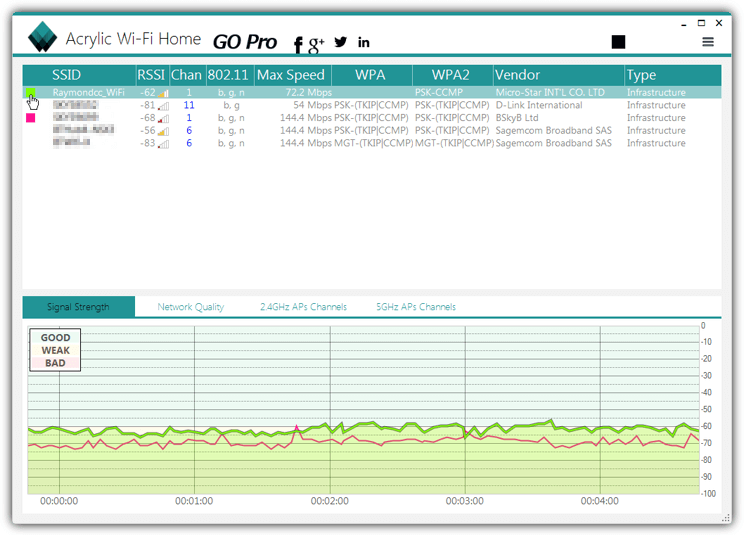
On install and launch click Options (3 horizontal lines) and choose Advanced Mode to make the graph full width and remove the useless Pro only network quality pane. To remove a wireless network from the graph click on the color block to the left of its name in the SSID list. The graph is colored into good and not so good strengths, highlighting an SSID will bold it for easier viewing, Microsoft .NET 4.5 is required which will need to have been installed on Windows 7 or Vista. Visual C++ 2012 Redistributables are also required.
5. Vistumbler
This tool has a few quite advanced options such as GPS support, live Google Earth tracking and a number of experimental features. More standard functions include getting WiFi signal strength and information as well as the ability to audibly speak out the signal strength to you.
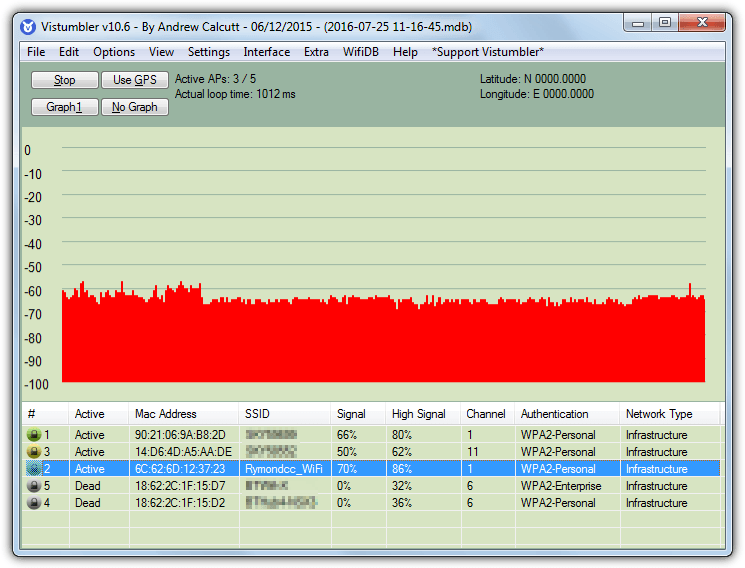
You don’t really have to do much to get the strength information after installation, simply click Scan APs and click on Graph 1 or Graph 2. Then click on a wireless network in the list to populate the graphs. The first is a simple line that measure signal strength over a few minutes. The second is a bar graph (pictured above) which shows the signal strength history for around 11 minutes. Changing the Refresh loop in Settings > Misc Settings to another value from the default of 1000ms (1 second) will lengthen or shorten the graph history time.
We did also look at Xirrus WiFi Inspector and NetSurveyor although both don’t log wireless signals for very long. Xirrus also requires you to fill in an online form to get the download link from the website.

Improve this guide

User forum
5 messages